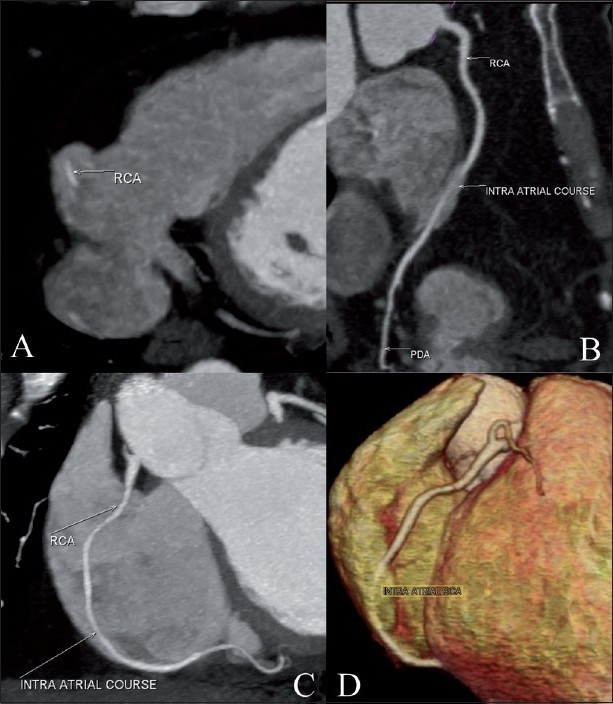
Figure 1 (A-D).

Cardiac CT. Axial maximum intensity projection (MIP) image (A) shows the intra-atrial location of the right coronary artery (RCA) (white arrow). The curved multiplanar reconstruction (B) and MIP (C) images show the normal origin and short intra-atrial course of the RCA (white arrows). The volume-rendered image (D) shows the entry and exit points of the RCA. Also, note the normal epicardial course of the proximal and distal RCA
