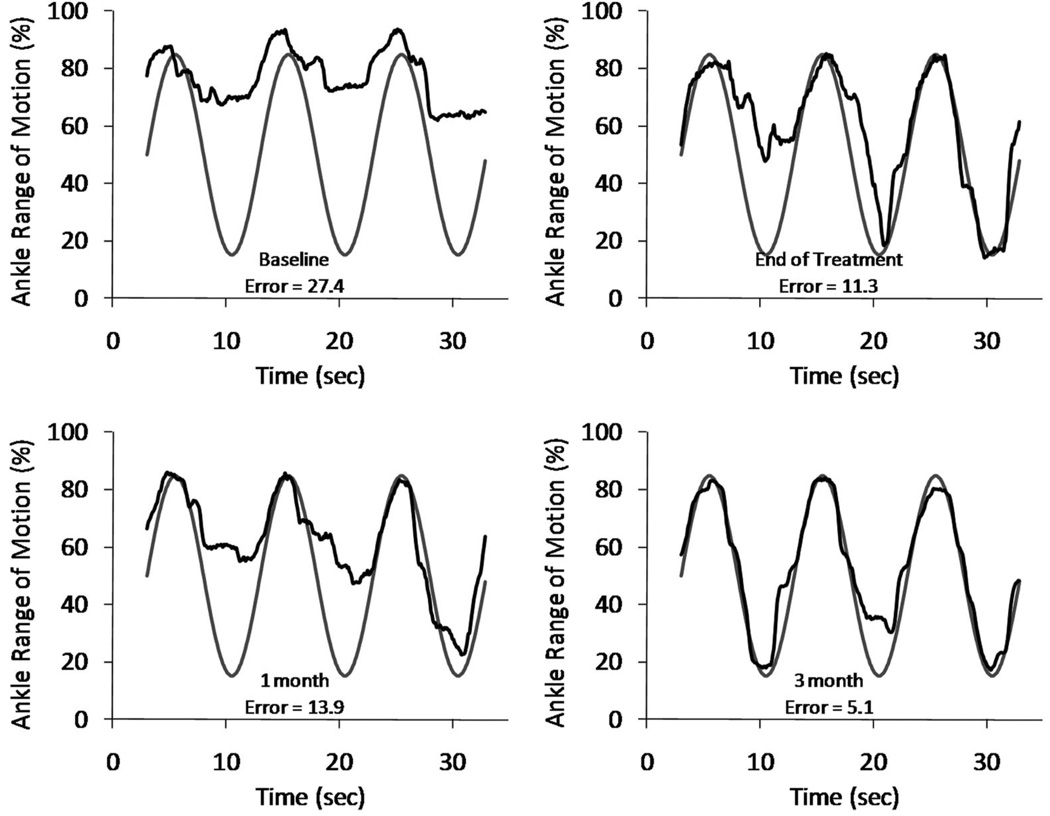
FIGURE 3.
Sample trials of ankle movement tracking assessment for subject 2. Vertical axis represents the subject’s ankle range of motion achieved that day, such that 100% corresponds to maximum voluntary dorsiflexion and 0% corresponds to ankle resting angle. Error indicated is for that particular trial.

