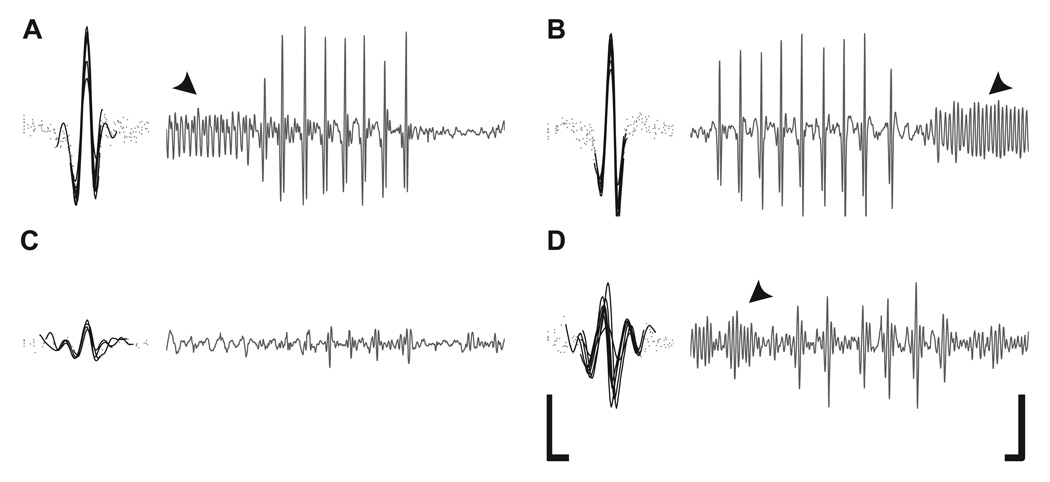
Figure 3.
Representative traces of courtship song output. The left panel displays individual pulses within a pulse train aligned by midpoint of energy. Solid lines indicate amount of trace required to include 90% of the signal’s energy (pulse width). Right panel displays the whole trace. Arrowheads indicate sine song. (A) tshGAL4/+ controls, (B) tshGAL4/UAS-fruMIR; n-sybGAL80 rescue flies, (C) representative small amplitude and (D) polycyclic nature of tshGAL4/UAS-fruMIR courtship song. Scale bars: Left panel, horizontal 5 ms, vertical 5 mm s−1. Right panel, horizontal 25 ms, vertical 5 mm s−1.

