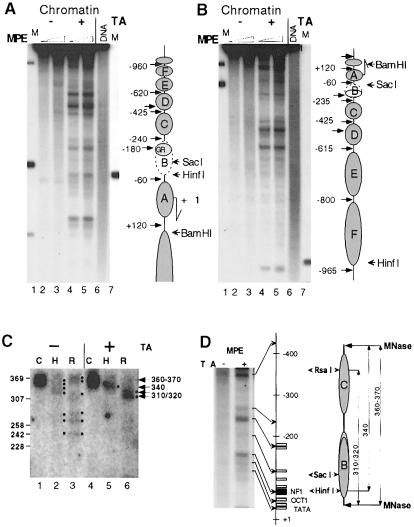
Fig. 4. Hormone-induced nucleosome positioning analyzed by MPE and MNase digestion in situ. (A and B) Transcriptional activation leads to establishment of nucleosome positioning along the MMTV promoter. Injected oocytes were analyzed after 24 h of hormone treatment. MPE digestion was performed for 3 min (lanes 2 and 4) and 10 min (lanes 3 and 5). Isolated DNA was digested with SalI and EcoRV, resolved on agarose, blotted and hybridized first with a random-primed labeled fragment adjacent to the EcoRV site (EcoRV–SacI fragment in A) and then stripped and reprobed with SalI–RsaI (B). Lanes 1 and 7, internal molecular weight markers (see map to the right); lanes 2–5, MPE digestion of injected oocytes, treated (lanes 4 and 5) and not treated (lanes 2 and 3) with hormone; lane 6, naked dsMMTV promoter DNA digested with MPE. To the right in (A) and (B) is a schematic summary of MPE cuts along the MMTV LTR with putative nucleosome positions. (C) Mapping of dinucleosome borders suggests that nucleosomes are translationally positioned along the MMTV promoter only after activation of transcription. Groups of 10 oocytes were hormone treated as in (A) and (B) and MNase digested as in Figure 2B (lanes 3 and 8). DNA was isolated and resolved in a 4% NuSieve GTG agarose gel together with size markers. The band corresponding to dinucleosome DNA (360–370 bp in length) was excised from the gel, DNA was eluted and analyzed as a control (lanes 1 and 4) or digested either with HinfI (lanes 2 and 5) or RsaI (lanes 3 and 6). DNA was resolved in a 1% SeaKem GTG + 2.5% NuSieve GTG agarose gel, blotted and hybridized with a random-primed probe encompassing region –415/–100. Black dots outline the DNA bands revealed by hybridization. (D) Chromatin organization of the MMTV promoter as revealed by MNase and MPE mapping. A magnified section of lanes 3 and 4 in (A) is shown together with a schematic presentation of the MMTV LTR and the restriction enzyme cleavage sites. All symbols are as in Figure 1A. The positions of the nucleosomes (on the right) are based on the results in (A–C). The co-localizations of MPE cuts with internucleosome linkers and/or factor-binding sites are indicated by arrows.

An official website of the United States government
Here's how you know
Official websites use .gov
A
.gov website belongs to an official
government organization in the United States.
Secure .gov websites use HTTPS
A lock (
) or https:// means you've safely
connected to the .gov website. Share sensitive
information only on official, secure websites.
