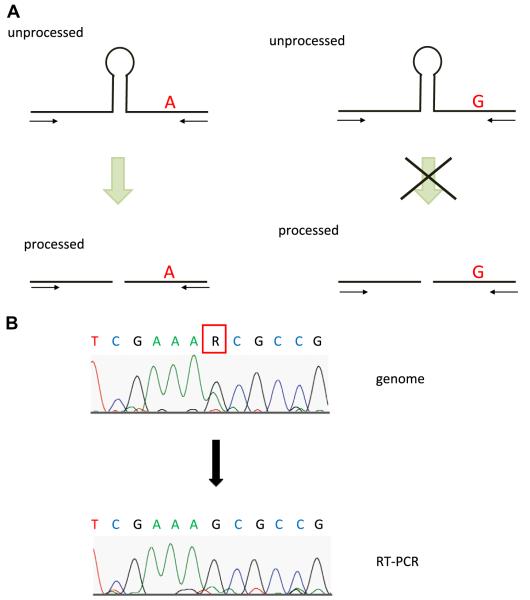
Fig. 3.
Endogenous expression of unprocessed pri-miR-126 in RS4;11. (A) pri-miR-126-24A is processed, while pri-miR-126-24G is the less processed than pri-miR-126-24A. (B) Expression of unprocessed pri-miR-126 derived from 24G was much higher than that from 24A. The DNA chromatograms illustrates the genomic sequence of pri-miR-126 DNA from RS4;11 cells (upper column). Nucleotides are indicated by capital letters. R indicates the A and G. The DNA chromatograms illustrates the cDNA sequence of pri-miR-126 from RS4;11 cells (lower column). The sequence of the unprocessed pri-miR-126 dominantly shows G, derived from miR-126-24G.

