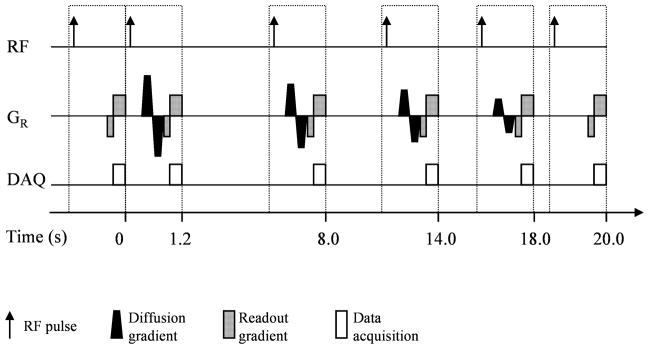
Fig. 1.
Schematic diagram of the optimal measurement scheme for the simultaneous measurement of p0, R and ADC with HP 3He MRI. The inter-scan time of this scheme is relatively long in the middle and short at the two ends. The bipolar diffusion-sensitization gradient is applied along the readout direction. Its magnitude decreases with the measurement. For simplicity, the slice selection and phase coding gradient are not shown in the figure.

