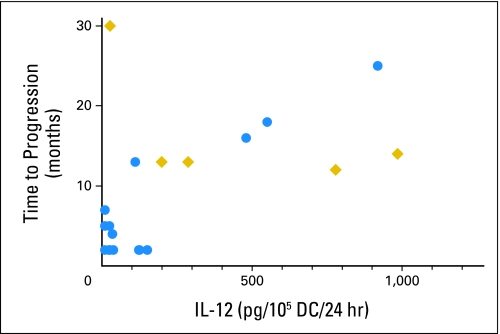
Fig 1.
Interleukin (IL) -12 production levels positively correlated with time to progression. P = .0255 is based on Cox regression followed by likelihood-ratio test. Circles indicate patients who have already experienced disease progression; diamonds represent patients who have not experienced recurrence to date. DC, dendritic cells.

