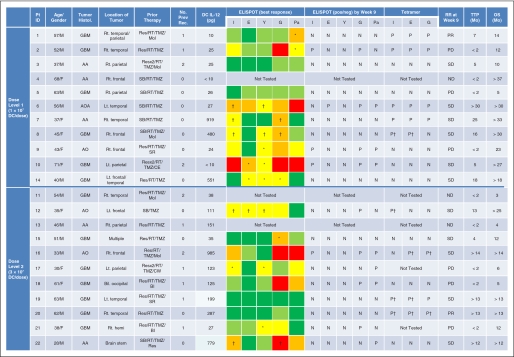
Fig A1.
Patient demographics, immune and clinical responses. Results of interferon (IFN) - γ enzyme-linked immunosorbent spot (ELISPOT) assays are summarized as a heat map. Each color indicates a range of positive spots per 105 CD8+ cells at the time point that indicated the maximum response for each patient: dark green for less than 25, light green for 25 to 49, yellow for 50 to 99, orange for 100 to 199, and red for greater than 200. (*) Only a single point, but not two or more consecutive points, demonstrated 50 or more spots/105 cells (thus not positive). (†) Positive only after booster vaccines. Pt, patient; ID, identification number; Histol, histology; No Prev Rec, number of previous recurrences; DC IL-12, production of IL-12 p70 by αDC1 (pg/105 cells/24 hours); RR, radiologic response; TTP, time to progression; OS, overall survival; Mo, month; M, male; GBM, glioblastoma multiforme; Rt, right; Temp, temporal; Pa, parietal; Res, resection; RT, radiation therapy; TMZ, temozolomide; Mol, molecularly targeted therapy; I, IL-13α2; E, EphA2; Y, YKL-40; G, gp100; Pa, PADRE; N, negative; P, positive; PR, partial response; PD, progressive disease; AA, anaplastic astrocytoma; SD, stable disease; F, female; SB, stereotactic biopsy; ND, not determined due to early progression before week 9; AOA, anaplastic oligoastrocytoma; Lt, left; AO, anaplastic oligodendroglioma; SR, stereotactic radiosurgery; CE, carboplatin and etoposide; CW, carmustine-releasing wafer; Bil, bilateral; BI, bevacizumab and irinotecan; Hemi, hemispheric.

