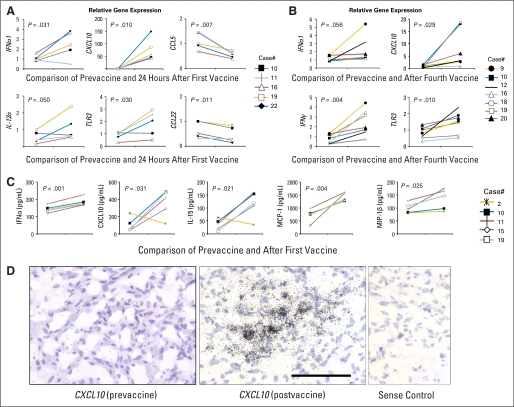
Fig A2.
Induction of type-1 cytokine and chemokine responses. Line graphs represent paired relative gene expression by reverse transcriptase polymerase chain reaction on one day before the first vaccination compared to (A) 24 hours or (B) 9 weeks after first vaccine. (C) Luminex analyses were performed in pre-first and post-fourth vaccine serum samples. Values indicate concentrations of cytokine/chemokines by pg/mL. (A-C), Numbers in each panel indicate P values based on paired t test using the means of (A and B) ΔΔCT value or (C) concentration for each patient. (D) Patient 1 demonstrated increase in the size of gadolinium-enhanced lesion after two booster vaccines and underwent surgical resection of the lesion. In situ hybridization detected mRNA for CXCL10 (dark spots) in the postvaccine tissue but not in the initially resected tumor (prevaccine). None of two other prevaccine tissues demonstrated positive CXCL10 messages (data not shown). The scale bar equals 100 μm. Hematoxylin and eosin staining was performed for background. IL, interleukin; IFN, interferon.

