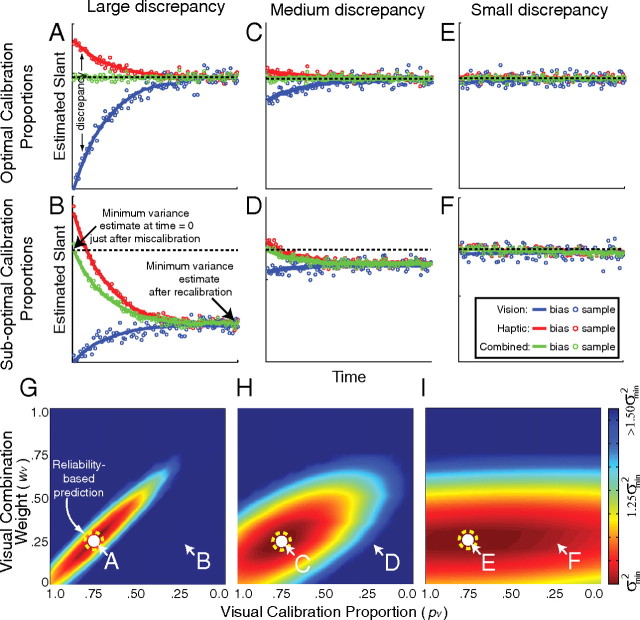
Figure 5.
Simulation results for estimators with the reliability ratio (rV:rH) set to 1:3 and an adaptation rate of 0.05. Different adaptation rates did not change the qualitative effects. For different combination weights and calibration proportions, we calculated the variance of the combined estimate over time for 1000 simulated trials following an initial discrepancy. The left, center, and right columns represent the results when the visual–haptic discrepancy introduced at time 0 was large (5σV2), medium (σV2), and small (σV2/5), respectively. The estimators did not drift randomly. The panels in the upper two rows plot the visual, haptic, and combined estimates over time (blue, red, and green, respectively). The upper row shows adaptation when the visual calibration proportion (pV) was appropriate for reliability-based adaptation (pV = 1 − wV). The middle row shows adaptation when the visual calibration proportion was inappropriate for reliability-based adaptation (pV = wV). The bottom row summarizes adaptation for a wide variety of parameters. The abscissa is the visual calibration proportion (pV). The ordinate is the visual combination weight (wV). Color represents the variance of the combined estimate over time, dark red representing the smallest variance. The white circles indicate the position of minimum variance in each figure. The white-lettered labels A–F indicate the parts of those surfaces that are shown in the panels of the upper two rows. The dashed yellow circles indicate the optimal calibration rule given that rV:rH equaled 1:3: the visual calibration proportion and visual combination weight that should yield minimum variance according to the reliability-based model.

