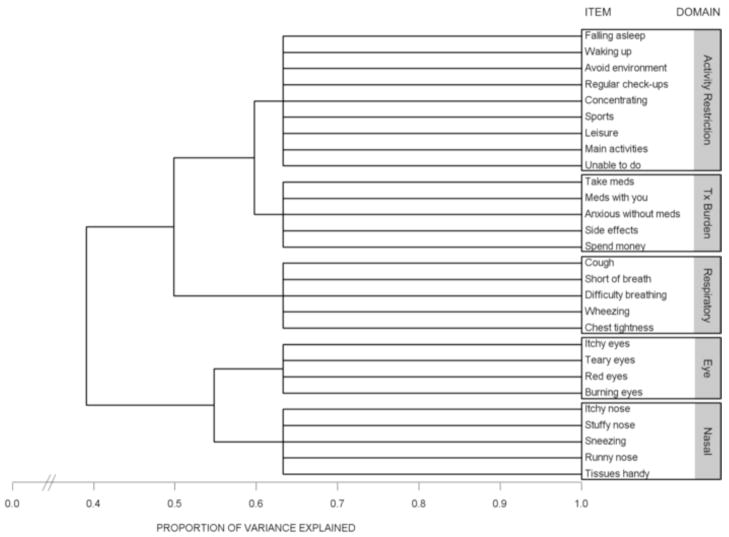
Figure 2.
Dendrogram (or “Tree” diagram) illustrating the iterative splitting technique utilized by variable cluster analysis. Successive splits are shown from left to right. The distance of each vertical branch from the origin at the left represents the proportion of variance explained for each cluster solution. The total variance explained by the 5-cluster solution was 63.3%.

