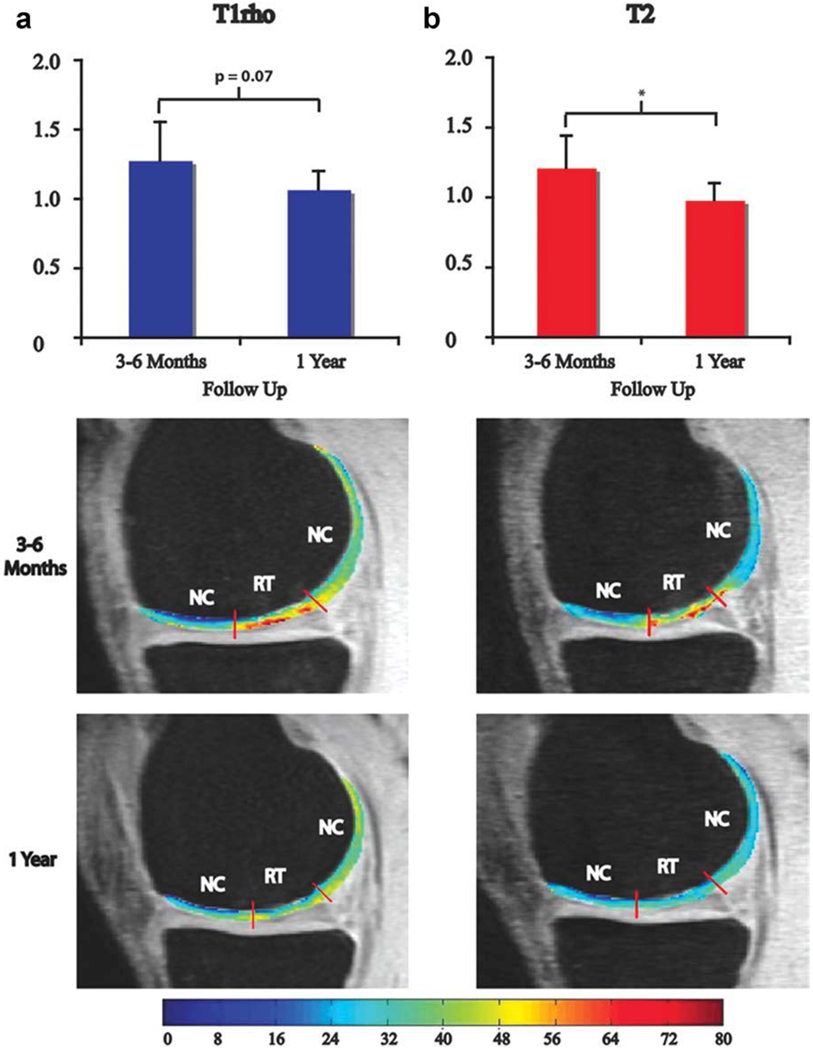
Figure 4.
(a) T1ρ RT/NC ratios and representative T1ρ maps and (b) T2 RT/NC ratios and representative T2 maps 3–6 months and 1 year after MFx surgery. The RT/NC ratio for T1ρ values was approaching a significant difference between 3–6 months and 1 year (P = 0.07; a) and was significantly different for T2 values between 3–6 months and 1 year (P = 0.02; b). *Significant difference for T2 RT/NC ratios between 3–6 months and 1 year; MFx, microfracture; MOS, mosaicplasty; RT, regenerated tissue; NC, normal cartilage.

