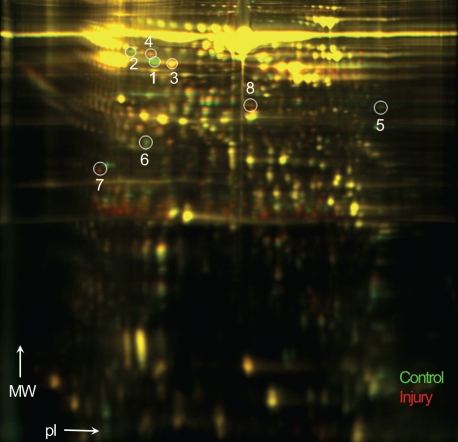
Figure 2.
2D-DIGE showing differentially expressed proteins after 2 weeks of carotid artery injury in rats. Green spots represent proteins from the control plasma, whereas red spots indicate proteins from vascular injury samples. Proteins were separated according to molecular weight (MW) and isoelec-tric point (pI). Circles and numbers refer to spots in which proteins were identified by MS.

