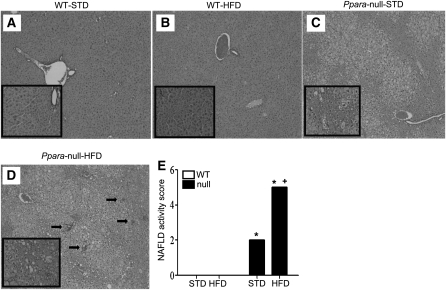
FIGURE 1.
Liver histology of WT and Ppara-null mice fed STD or HFD for 3 wk (A–D). Hematoxylin and eosin stain shows intracellular lipid accumulation and inflammation (200×). The enclosed box in each panel shows the enlarged images (400×) and black arrows (D) indicate inflammatory foci. (E) Values are means ± SEM, n = 4 or 3 (WT STD). *Different from corresponding WT group, P = 0.05; +different from Null-STD, P = 0.05. A color version of this figure is available online as Supplemental Figure 2.

