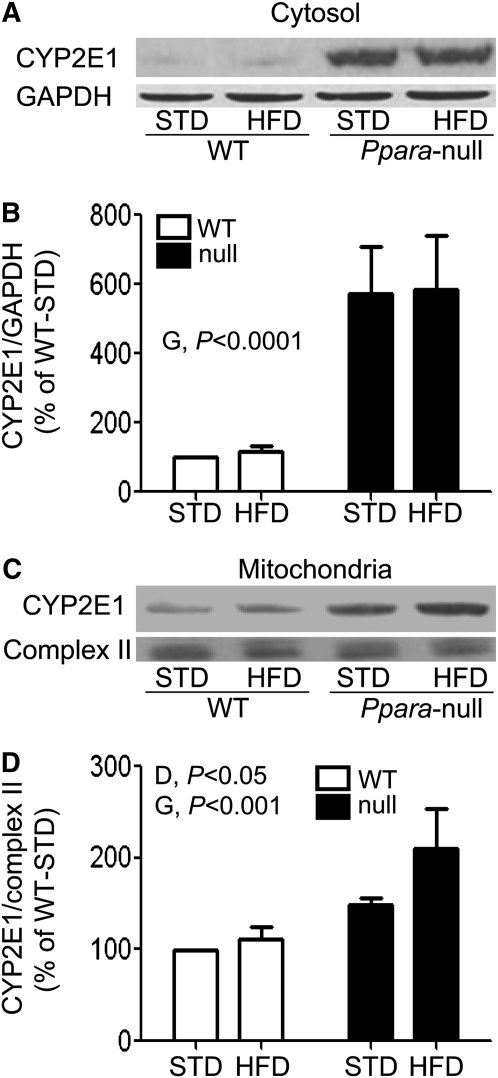
FIGURE 3.
Levels of CYP2E1 protein in cytoplasm (A) or mitochondria (C) in livers of male WT and Ppara-null mice fed STD or HFD for 3 wk. The densities measured by immunoblot analysis were normalized to GAPDH (B) and complex II subunit (D), respectively, and were plotted as a percentage of the value in WT-STD mice. Values are means ± SEM, n = 4 or 3 (WT-STD). G, genotype; D, diet.

