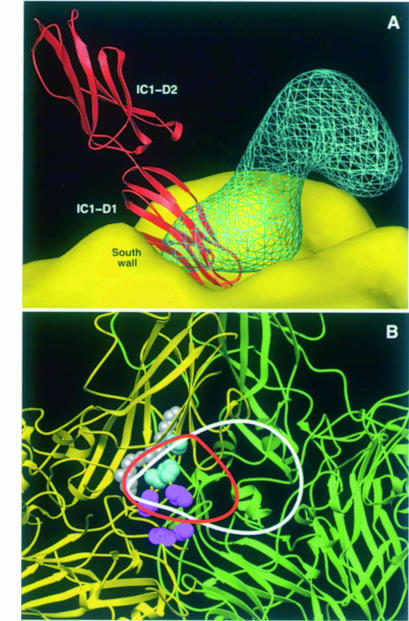
Fig. 7. PVR and IC1-binding modes and footprints. (A) View of the electron density for a PV-bound PVR molecule (blue lines), the PV1/M molecular surface (yellow) and an HRV16-bound IC1 molecule (red). A ribbon representation of the crystal structure of domains 1 (D1) and 2 (D2) of IC1 (Bella et al., 1998; Casasnovas et al., 1998b) fitted in the cryo-EM electron density of the reported HRV16–IC1 complex (Olson et al., 1993) is shown. The IC1 molecule has similar orientation to that previously reported (Bella et al., 1998). Structures of PV1/M and HRV16 were superimposed to generate the figure. (B) Lines defining the footprint of PVR (white) and IC1 (red) were drawn around the virus proximal cryo-EM density of the bound receptor molecules. The panel shows a view toward the center of the particle, with two PV1/M promoters colored in yellow and green. Defined receptor-binding residues in PV1 (see Figure 6) and HRV (Colonno et al., 1988) are colored magenta and cyan, respectively.

An official website of the United States government
Here's how you know
Official websites use .gov
A
.gov website belongs to an official
government organization in the United States.
Secure .gov websites use HTTPS
A lock (
) or https:// means you've safely
connected to the .gov website. Share sensitive
information only on official, secure websites.
