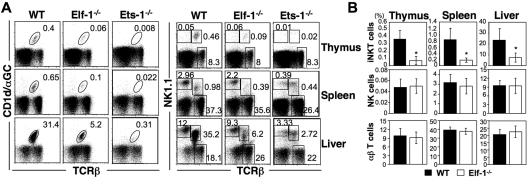
Figure 1.
Elf-1−/− mice display a severe defect in iNKT-cell development. Single-cell suspensions from the thymus, spleen, and liver of WT, Elf-1−/−, and Ets-1−/− mice were stained with CD1d/αGalCer tetramer, anti–TCRβ, and anti–NK1.1, and then analyzed by flow cytometry. (A) Left, numbers represent the percentage of iNKT cells in the indicated organs. Right, numbers represent the percentages of NK, conventional T cells, and total NKT cells in the indicated organs. Results are representative of 3 experiments. (B) Bar graphs depict the means ± SD for the proportion of iNKT, NK, and NK1.1−αβ T cells in the indicated organs of WT and Elf-1−/− mice (n = 15 for each group; *P < .05).

