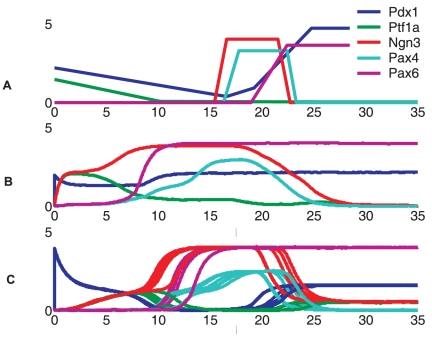
Figure 5. Temporal gene expression profile during pancreatic cell differentiation.
In this figure different colors denote different genes. (A) Experimental observations of both gene expression levels and timing are qualitative reported in [18]. (B) Simulation results from the master model. (C) Simulation result of an alternative model with the inhibitory effects of Pdx1 upon Ngn3 and Ptf1a.

