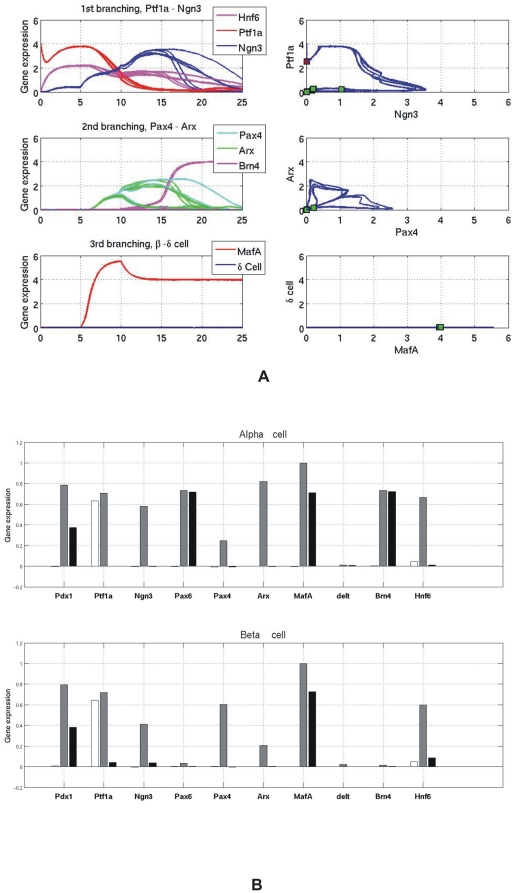
Figure 8. The gene expression profiles of cell reprogramming with the recipe Pdx1, Ngn3 and MafA.
(A) Gene expression profiles of pancreatic exocrine cells being reprogrammed to β cells. Three genes, Pdx1, Ngn3 and MafA are over-expressed as the extra production terms in the model. Besides β cells appear, α cells also appear after reprogramming. (B) Ten gene expression patterns in reprogrammed pancreas α and β cells with the recipe: Pdx1, Ngn3 and MafA. White – Initial values; Gray – Maximum value; Black – Final value.

