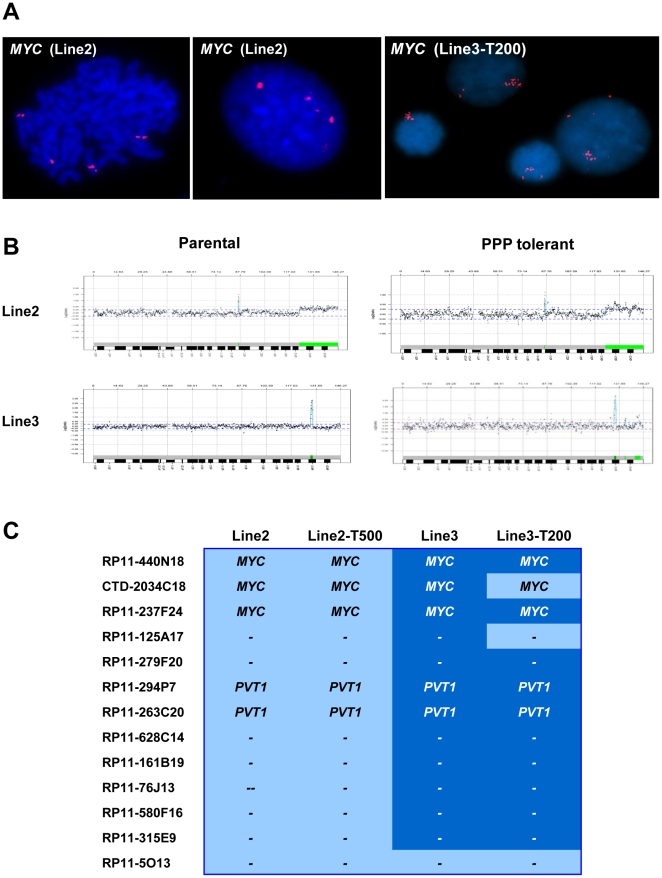
Figure 1. Gains and amplifications involving 8q24.21 and verification of array-CGH results by FISH for the MYC locus.
(A) FISH analysis using a Spectrum Orange labelled BAC clone covering the MYC locus. Line2 cells in metaphase show red signals on 4 individual chromosomes as well as 4 signals in interphase. In interphase nuclei of Line3-T200 cells single individual red spots are observed together with clusters of more than 10 signals suggesting a homogeneously staining region. (B) Array-CGH profiles for chromosome 8 in parental and PPP tolerant cells. Parental and PPP tolerant cells show gain of 8q24.13-qter in Line2, narrow amplification of 8q24.21 in Line3. (C) The heatmap illustrates the common regions of gain/amplification including the MYC and PVT1 loci, with gain indicated in light blue and amplifications marked in dark blue. The first column is the name of clones in the BAC array.

