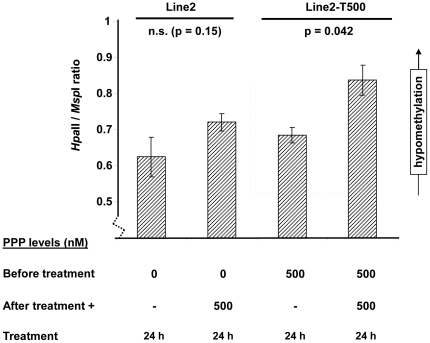
Figure 6. Global hypomethylation after PPP treatment of Line2 cells.
Methylation at CCGG sites measured by LUMA in PPP sensitive Line2 and tolerantLine2-T500 cells. The Y-axis shows the HpaII/MspI ratio, which correlates inversely to DNA methylation levels. Line2 cells cultured in PPP free media were short-term treated for 24 h with or without 500 nM PPP. Line2-T500 cells cultured in 500 nM PPP were similarly treated for 24 h by adding 500 nM PPP (total concentration 1000 nM). Peak heights were plotted with error bars ± SD. P-values were calculated using the t-test, n.s. = not statistically significant.

