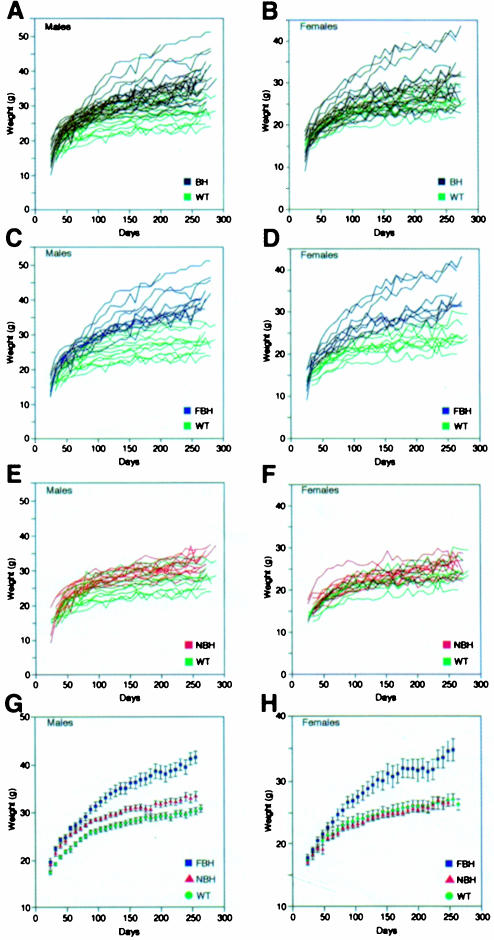
Fig. 1. BDNF heterozygous (BH) mice exhibit increased weight variation with increased age (A and B). Mutant mice are subdivided based on weight into fat heterozygous (FBH; blue), non-fat heterozygous (NBH; red) and wild-type (WT; green) groups for both males (C, E and G) and females (D, F and H). FBH mice weigh greater than two standard deviations above the mean weight of wild-type mice and fall outside the wild-type range (C and D), while NBH mice fall within the wild-type weight distribution (E and F). The growth curve for males (G) represents 13 FBH, 13 NBH and 40 wild-type mice, whereas that for females (H) includes nine FBH, 21 NBH and 17 wild type. Values represent the mean ± SEM.

An official website of the United States government
Here's how you know
Official websites use .gov
A
.gov website belongs to an official
government organization in the United States.
Secure .gov websites use HTTPS
A lock (
) or https:// means you've safely
connected to the .gov website. Share sensitive
information only on official, secure websites.
