Figure 1.
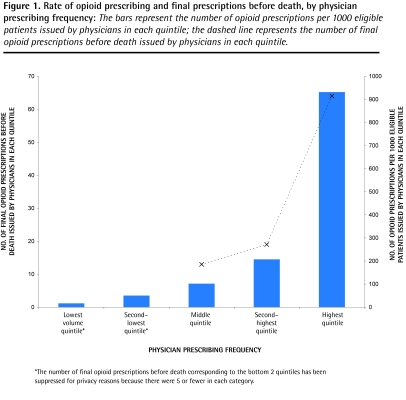
Rate of opioid prescribing and final prescriptions before death, by physician prescribing frequency: The bars represent the number of opioid prescriptions per 1000 eligible patients issued by physicians in each quintile; the dashed line represents the number of final opioid prescriptions before death issued by physicians in each quintile.
*The number of final opioid prescriptions before death corresponding to the bottom 2 quintiles has been suppressed for privacy reasons because there were 5 or fewer in each category.

