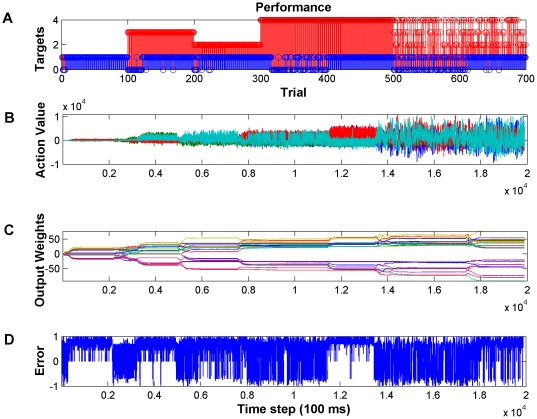
Figure 6. Decoding performance during sequential presentation of the targets in the four-target configuration.
(A) Sequential presentation of 4 targets as indicated by red stems. Blue stems indicate if the target was acquired (1) or missed (0). Note that when a new target is introduced the performance decreases but within a few trials it recovers. (B) Temporal sequence of action values. Each colored trace represents the value of one action (i.e. up, down, left, right). Note that for each target only certain actions have high value since they are required to acquire the target. (C) Weight values for the output layer of the Actor. Each colored trace corresponds to an individual weight. Note that when a new target is introduced that the weights adapt then plateau once the performance improves. (D) The temporal difference error becomes maximally positive when the targets are acquired.

