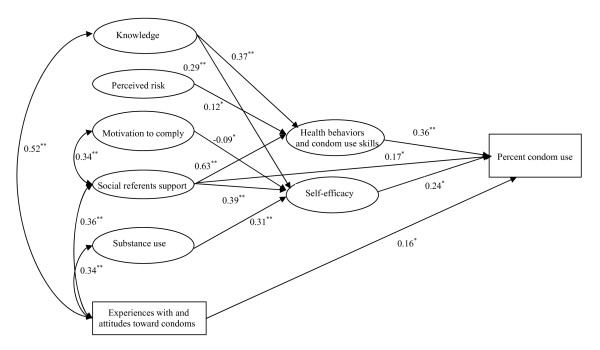
Figure 2.
The final predictive IMB model structural equation model. Structural equation model depicting significant regression paths in the IMB model (N = 427). Large circles represent latent variables; rectangles represent single-item indicators. Single-headed arrows represent regression coefficients; double-headed arrows represent correlations. Regression coefficients are standardized (*p≤0.05, **p≤0.001).

