Figure 3.

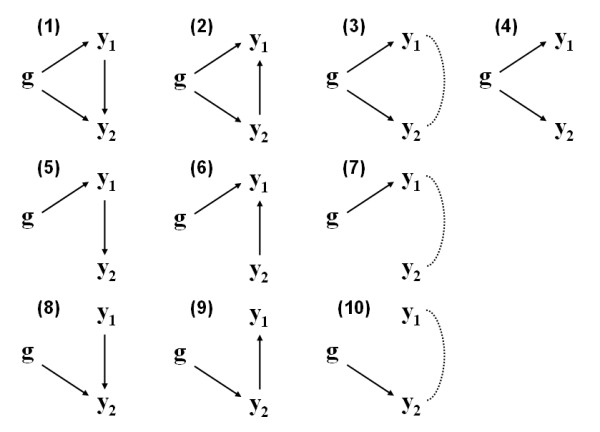
Causal relationships among a QTL (g) and two correlated phenotypes (y1 and y2). Arrows indicate the direction of causal effects and dotted lines represent unresolved associations between the two phenotypes (adapted from [8])

Causal relationships among a QTL (g) and two correlated phenotypes (y1 and y2). Arrows indicate the direction of causal effects and dotted lines represent unresolved associations between the two phenotypes (adapted from [8])