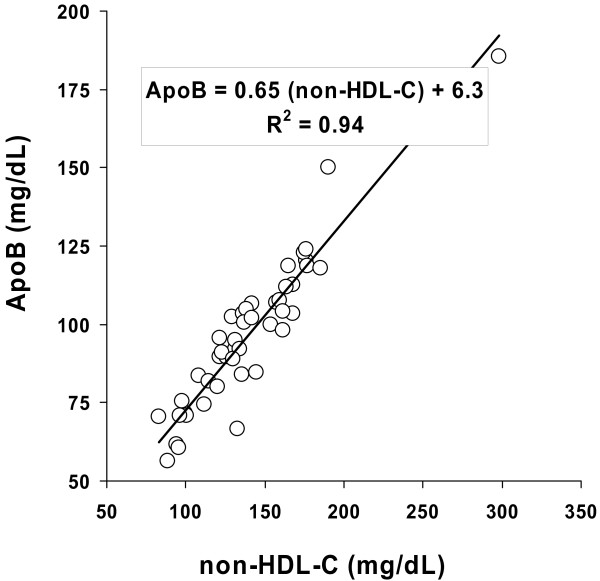
Figure 2.
Plots of means of duplicate measurements obtained on day 1 and day 2 for non-HDL-cholesterol (non-HDL-C; X axis) and apolipoprotein B100 (ApoB; Y axis) in n = 45 subjects with diabetes mellitus. The line represents the uncorrected linear regression equation relating non-HDL-C and apolipoprotein B100 [ApoB = 0.60 (non-HDL-C) + 12]. The insert box provides the unbiased equivalence equation which calculates ApoB from non-HDL-C based on the discriminant ratio methodology. R2 represents the measured Pearson correlation coefficient between tests, prior to attenuation adjustment.

