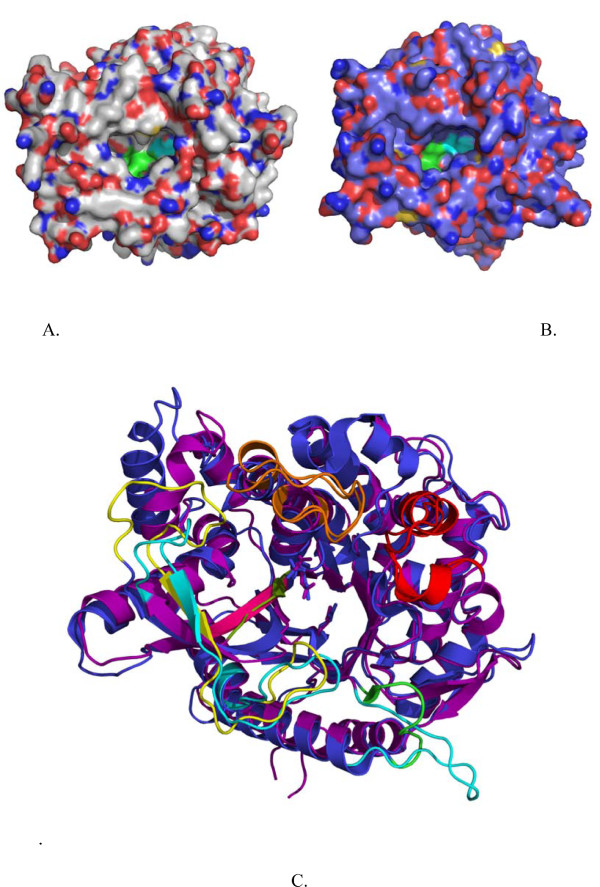
Figure 8.
Structural comparison of hCBG and TnBgl1A. Panel A and B show a surface view of hCBG (A.) and TnBgl1A (B.). The smaller entrance at the hCBG active site and wider entrance of the TnBgl1A active site are clearly visible. The overall similarity of the structures is shown by superimposition (C.) of the TnBgl1A (purple) and hCBG (blue) structures. The active site residues are shown as sticks. The fours loops surrounding the active site are indicated. Loops A (red), and B (orange) do not show differences but loop C (yellow in hCBG, cyan in TnBgl1A) and loop D (green in hCBG, cyan in TnBgl1A) presented big differences. Loop C, around the active site entrance, seems bigger in hCBG compared to TnBgl1A. Loop D on the other hand is long for TnBgl1A compared to the small and compact loop in hCBG. The β-strand close to the active site area (pink in TnBglA, green in hCBG) was chosen for mutagenesis.

