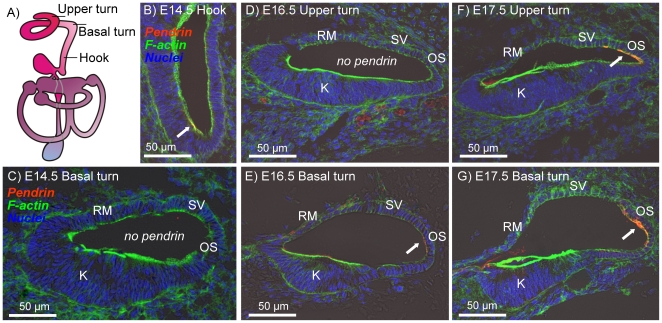
Figure 1. Onset of pendrin expression in the cochlea.
Pendrin (red) was visualized by immunocytochemistry. F-actin (green) and nuclei (blue) were labeled. A: Diagram of the inner ear. B–G: Cross-sections of the cochlear duct in the hook region (B), basal turn (C, E and G) and upper turn (D and F) of Slc26a4+/− mice at age E14.5 (B and C), E16.5 (D and E) and E17.5 (F and G). Abbreviations: K, Kölliker's organ; RM, Reissner's membrane; SV, stria vascularis; OS, outer sulcus. Pendrin expression is marked by arrows.

