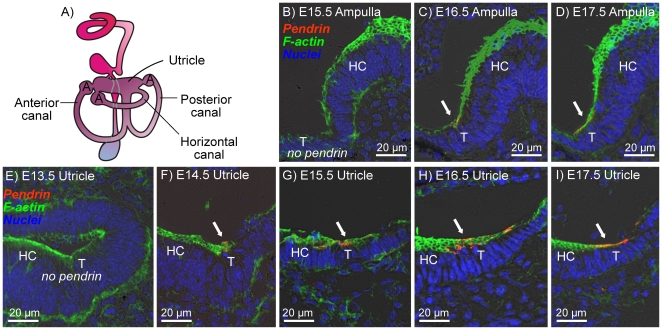
Figure 2. Onset of pendrin expression in the ampullae and utricle of the vestibular labyrinth.
Pendrin (red) was visualized by immunocytochemistry. F-actin (green) and nuclei (blue) were labeled. A: Diagram of the inner ear. B–D: Cross-sections of the anterior canal ampulla of Slc26a4+/− mice at age E15.5–E17.5. E–I: Cross-sections of utricle of Slc26a4+/− mice at age E13.5–E17.5. Abbreviations: A, Ampulla; T, transitional cells; HC, hair cells. Pendrin expression is marked by arrows.

