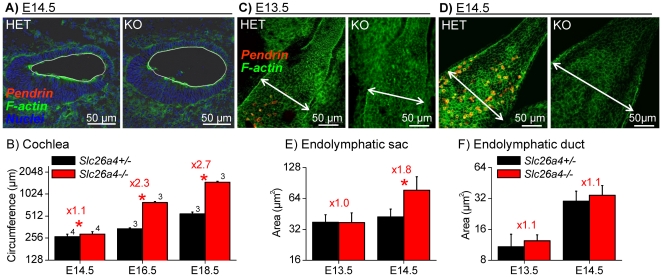
Figure 6. Onset of cell stretching in cochlea and endolymphatic sac.
Pendrin (red) was visualized by immunocytochemistry. F-actin (green) and nuclei (blue) were labeled. A: Cross-sections of the basal turn of the cochlea from Slc26a4+/− (HET) and Slc26a4−/− (KO) mice at age E14.5. The circumference of the cochlear lumen is marked by a white line. B: Summarized measurements (avg±sem) of the luminal circumference of the cochlea at ages E14.5–E18.5. Numbers next to the bars represent the N number of otocysts. Significant differences between Slc26a4+/− (black) and Slc26a4−/− (red) mice are marked with a star. C–D: Whole-mounts of the endolymphatic sac from Slc26a4+/− (HET) and Slc26a4−/− (KO) mice at ages E13.5 and E14.5. The width of the endolymphatic sac is marked by a double-arrow. E–F: Summarized measurements (avg±SD, each bar N = 15) of the apical surface area of epithelial cells in the endolymphatic sac and duct at ages E13.5–E14.5. Significant differences between Slc26a4+/− (black) and Slc26a4−/− (red) mice are marked with a star. Figures preceded by ‘x’ indicate the factor between measurements in Slc26a4+/− and Slc26a4−/− mice.

