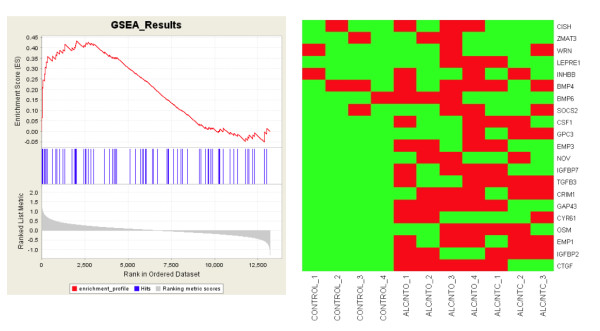
Figure 4.
Illustration of Gene Set Enrichment Analysis (GSEA) informatics with neurotrophic factor related gene set. (Left panel) Profile of the running enrichment score (ES) and positions of a prominent neurotrophic factor related gene set, GO:0040007: Growth, on the rank ordered list GSEA output for the comparison ALC vs. CONTROL. This test is a one-way test, i.e. whether gene expression is higher in control than in ALC. The x-axis lists all the genes ranked based on their associations with phenotype, i.e. the comparison ALC vs. CONTROL. The blue vertical bars indicate candidate genes in the target gene set. The ES profile records the cumulative score of the gene ranks from the target gene set. If a majority of gene ranks from the candidate gene set are high (i.e. toward the start of ranking) compared to the rest of genes, the cumulative ranking score (profile) will have a high peak, suggesting a significant enrichment of this gene set. The statistical significances (p-value) were calculated based on the height of this peak through a permutation test (p-value = 0.010 in Experiment 1 and 0.005 in Experiment 2). (Right panel) The significant genes (enriched in control) are determined by the position of the peak of the profile. There are 21 candidate genes up to this peak position which are claimed as significant. They are plotted in the Heatmap (green means high expression level, and red means low expression level) in Experiment 2.

