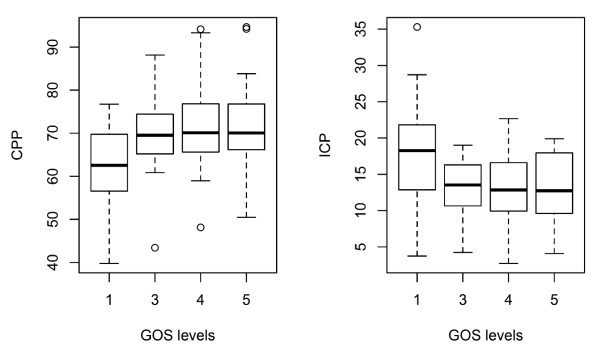
Figure 8.
Glasgow Outcome Scale (GOS) score vs. cerebral perfusion pressure (CPP) and intracranial pressure (ICP). Significant differences in means (per subject) were seen for CPP (P = 0.014) and ICP (P = 0.021) when compared to GOS levels (one-way analysis of variance). The box-and-whisker plot indicates the median, the lower and upper quartiles (boxes) and the 1.5 * interquartile range (whiskers). Outliers (outside whiskers) are indicated as circles.

