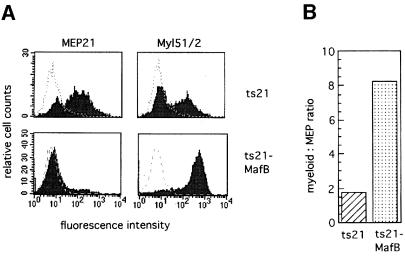
Fig. 3. Phenotype of transformed colonies obtained from ts21- or ts21-MafB-infected chicken hematopoietic progenitor cells. (A) FACS profiles of cells from pooled colonies of methylcellulose cultures using monoclonal antibodies against the multipotent progenitor antigen MEP21 or the myeloid antigen Myl51/2. The dotted line overlay shows the staining with an isotype-matched control monoclonal antibody against an intracellular antigen. (B) Graph showing the ratio of Myl51/2-positive to MEP21-positive cells calculated from the average of three colony assays each from ts21- and ts21-MafB-infected cells.

An official website of the United States government
Here's how you know
Official websites use .gov
A
.gov website belongs to an official
government organization in the United States.
Secure .gov websites use HTTPS
A lock (
) or https:// means you've safely
connected to the .gov website. Share sensitive
information only on official, secure websites.
