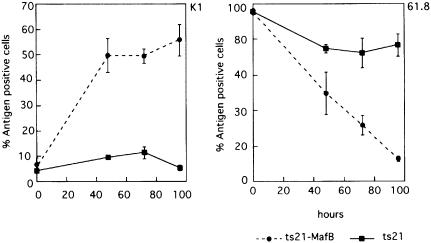
Fig. 6. Time course for the expression of the macrophage antigen K1 and the myeloblast antigen 61.8 after temperature shift to 42°C of ts21 control clones (–––) and ts21-MafB clones (------). The average of antigen-positive cells from four ts21-MafB clones and three ts21 control clones is shown. Error bars indicate the SEM.

An official website of the United States government
Here's how you know
Official websites use .gov
A
.gov website belongs to an official
government organization in the United States.
Secure .gov websites use HTTPS
A lock (
) or https:// means you've safely
connected to the .gov website. Share sensitive
information only on official, secure websites.
