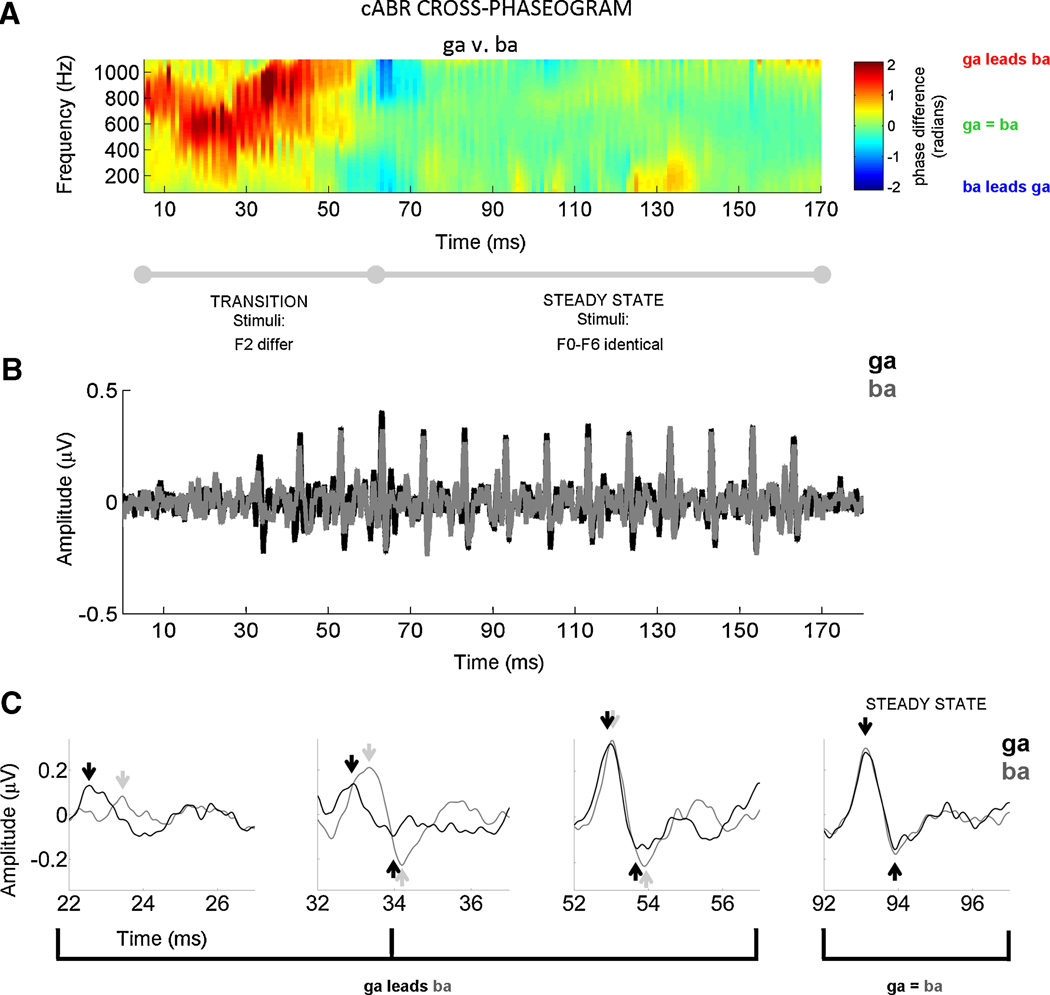
Figure 2. Cross-phaseogram of auditory brainstem responses.
A representative subject is plotted to illustrate that individual-subject comparisons are particularly accessible, a feature that makes the cross-phaseogram method clinically useful. This subject (male, age 12) had normal audiometry (pure tone average of 1.6 dB), normal language ability, and he performed at the 87.4th percentile on the Hearing in Noise Test. (A) Auditory brainstem responses to the speech sounds [ga] and [ba] are compared using the cross-phaseogram, a method which calculates phase differences between responses as a function frequency and time. In the cross-phaseogram, the time displayed on the x-axis refers to the midpoint of each 20 ms time bin. The y-axis represents frequency and the color axis represents the phase difference (in radians) between the response to [ga] and the response to [ba]. When the responses [ga] and [ba] are in phase, the plot appears green. When the response to [ga] leads in phase relative to [ba], this is represented using yellows, oranges and reds, with dark red indicating the largest differences. However, when the converse is true (i.e., [ba] response leads [ga] response), the plot is represented with shades of blue, with dark blue indicating the greatest phase differences. As can be seen in this plot, phase differences between the responses are restricted to the formant transition region (15–60 ms). As predicted from Johnson et al., 2008 and Hornickel et al., 2009, the [ga] response phase leads [ba] during this time region. In the response to the steady-state (60 to 170 ms), the responses are almost perfectly in phase. (B) To enable comparisons between the phase and peak timing measurements, the time domain versions of the response waveforms are plotted ([ga] in black, [ba] in gray). In (C), the responses plotted in (B) are magnified at four time points (centered at 24, 34, 54, and 94 ms) to illustrate the timing differences between stimuli that are evident during the response to the formant transition region, but not during the response to the steady state portions of the stimuli. Thus, the timing differences between responses (B–C) manifest as continuous phase differences across a range of frequencies (A).

