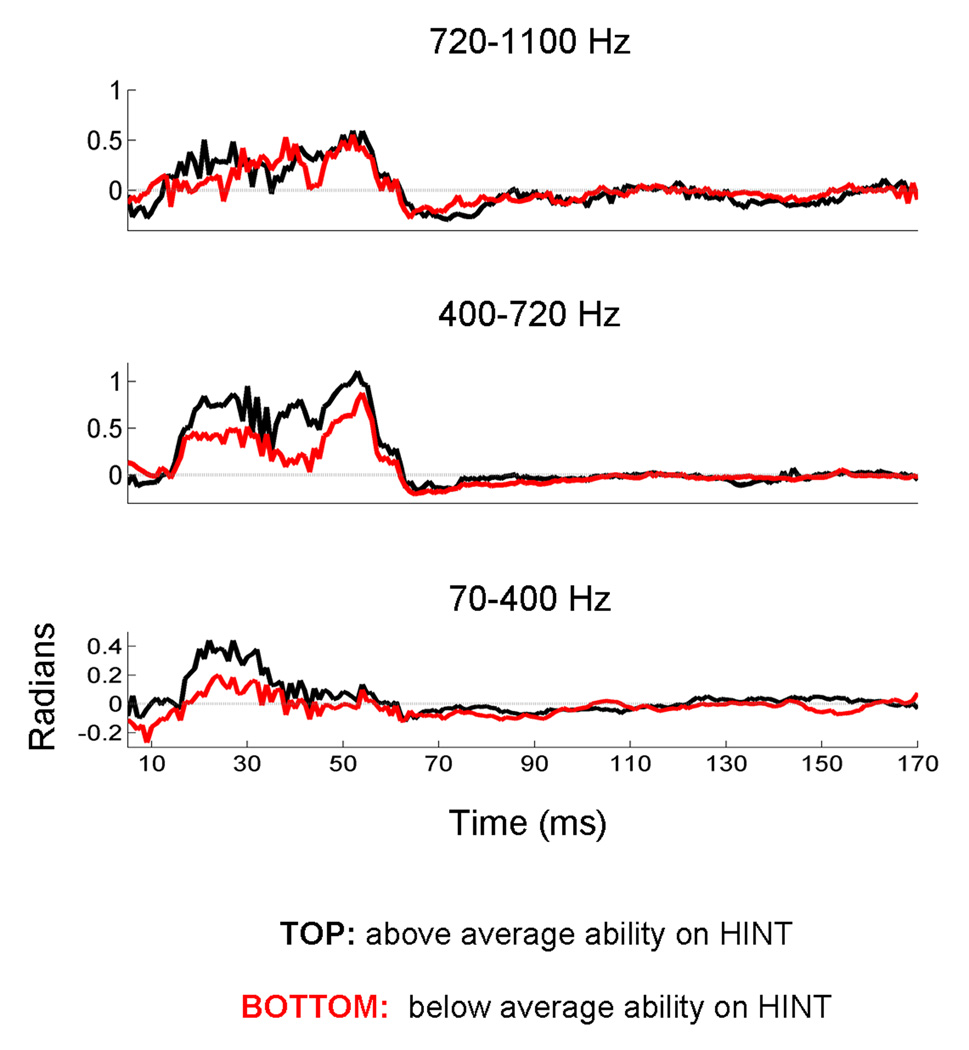
Figure 5. Deconstructing the response cross-phaseograms into frequency bands.
Average phase information is extracted over three frequency regions (A: 70–400 Hz; B: 400–720 Hz; C: 720–1100 Hz). Here the comparison between the responses to [ga] and [ba] is plotted for two groups of children, grouped according to their performance on a standardized test of speech perception in noise. Response for the children performing in the top 50th percentile are plotted in black, and the group performing below this cutoff are plotted in red. This figure illustrates greater phase separation among children who perform above average on a speech-in-noise task compared to those performing below average. For each row, the y-axis (radians) is scaled to highlight cross-response phase differences, with zero radians being demarcated by a gray line. As would be predicted from Figure 4, responses to the steady-state portion of the consonant-vowel syllables (beginning ~60 ms) are characterized by cross-response phase differences that hover near zero radians. During the response to the formant transition region (15–60 ms), phase coherence deviates from zero, indicating that the responses differ in phase during this time region. Although the phase differences occur on different scales for each frequency range, within the formant transition region they occur in a consistent direction with the response to the higher frequency stimulus ([ga]) leading the response to the lower frequency stimulus ([ba]) in the pair.

