
Figure 3. SP SIR scores.
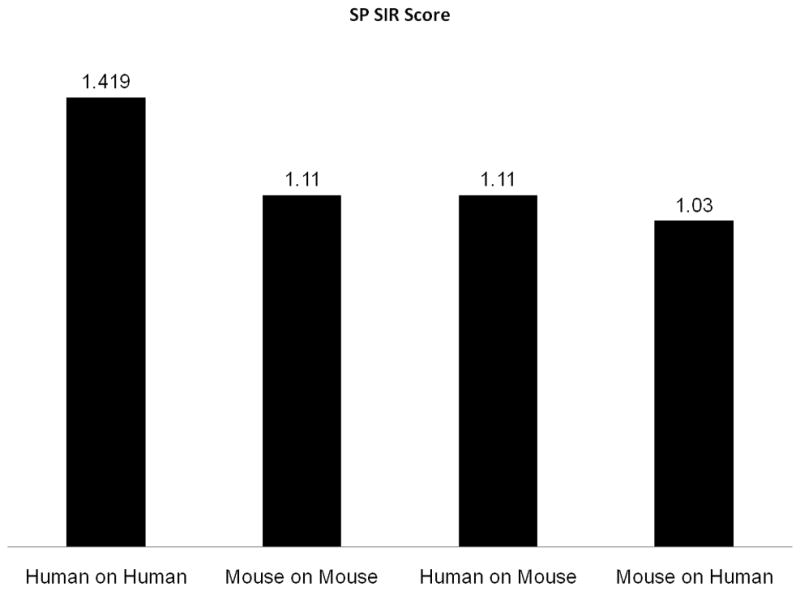
The first two columns are the SP SIR scores in human alleles (using human proteins) and in mouse alleles (using mouse proteins). The last two columns are the cross validation (human on mouse and mouse on human). All measurements were performed without the TAP computation. The first three columns are significant at a p<0.05 level.