
Figure 4. SP SIR scores.
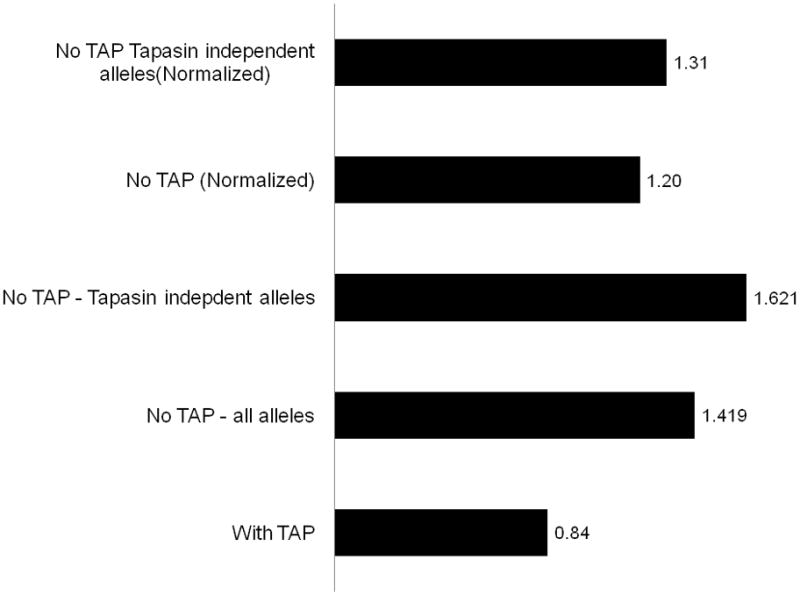
The first column is the full SIR score with TAP. The second column is the SIR without TAP. The third column is the SIR when only Tapasin independent alleles are incorporated. The last two columns are similar to the second and third columns, but divided by the SIR score of the same regions scrambled. These measures are used to estimate the effect of the hydrophobicity on the SIR score. Column 2, 3, and 5 are significantly higher than 1 (p<0.05). The SIR score was normalized to have an average SIR score of 1 on all human domains measured.