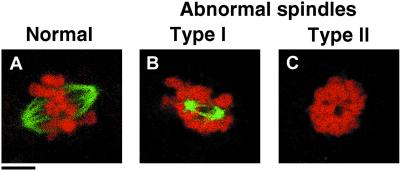
Figure 8.
The mitotic phenotypes of nonphosphorylatable Ala-substituted Op18 truncation derivatives. K562 cells were transfected, and hygromycin resistant cell lines were selected and induced with Cd2+ as in Figure 1. After 24 h, cells were fixed and double stained with anti-α-tubulin (green color) and propidium iodide DNA staining (red color). Representative examples of normal and abnormal metaphase cells, observed using laser scanning confocal microscopy, are shown. (A) Shows a typical normal metaphase cell, (B) shows a type I mitotic figure that lacks most kinetochore MTs; MTs appear as small star-like asters. Most cells contain two asters, suggesting that the centrosomes are separated. In addition, all the condensed chromosomes appear aggregated. (C) Type II mitotic figures represent the most severe defect, since MT structures were undetectable and the condensed chromosomes are aggregated. Bar, 4 μm.

