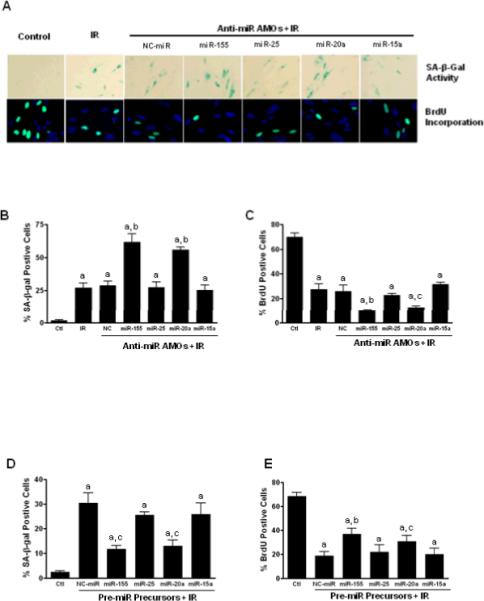
Fig. 5. Effect of SA-miRNAs on IR-induced cellular senescence.

WI-38 cells were transfected with specific AMOs against individual SA-miRNAs (50nM) or negative control miRNAs (NC). Two days after transfection, cells were irradiated (5Gy) to induce cellular senescence. A. upper panel, representative pictures of IR-induced senescent cells showing SA-β-gal positive staining (Blue); lower panel, representative pictures of proliferating cells that are positive for BrdU staining (Green). B. Quantification of senescent cells was determined by SA-β-gal staining. Results are presented as mean ± SE (n = 4). C. Seven days after irradiation, cells were pulsed with BrdU (10 nM) for 24 hours and percentage of BrdU positive cells were counted and plotted. D & E. WI-38 cells were transfected with pre-miR™ precursors (50nM.) or negative control pre-miRNAs (NC-miR). Two days after transfection, cells were irradiated (5Gy) to induce senescence. Senescent cells were determined by SA-β-gal staining (D) and cell proliferation was determined by BrdU incorporation assays (E). Data are presented as mean ± SE (n = 3). a, P < 0.001 vs. control (Ctl); b, P < 0.01 vs. NC + IR; c, P < 0.05 vs. NC + IR.
