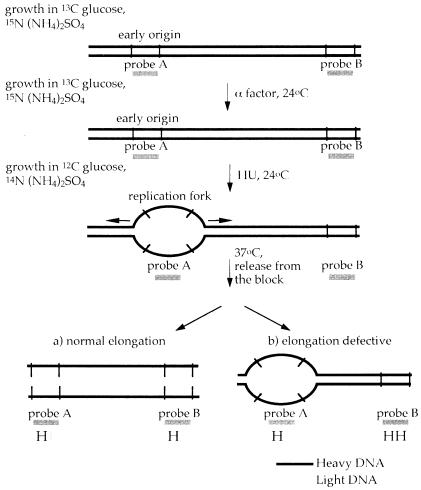
Fig. 5. An assay to examine replication fork progression. DNA substituted with dense isotopes is shown as thick black lines while DNA made in the presence of light isotopes is shown as thinner grey lines. Vertical lines represent restriction sites and the positions of probes for DNA blot hybridization are shown. See text for details.

An official website of the United States government
Here's how you know
Official websites use .gov
A
.gov website belongs to an official
government organization in the United States.
Secure .gov websites use HTTPS
A lock (
) or https:// means you've safely
connected to the .gov website. Share sensitive
information only on official, secure websites.
