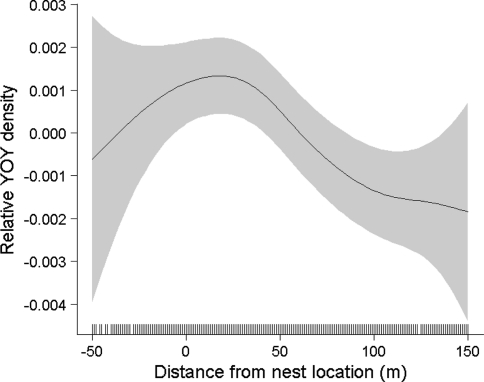
Fig. 4.
Estimated smoothing curve (shaded area represents 95% confidence interval) for the generalized additive model describing the overall spatial variation in YOY Atlantic salmon abundance in 10 study sites in the River Conon as a function of distance from nest site. Zero represents the location of the nest, and negative location values are in the upstream direction. Etchings on the inside of the x-axis indicate locations of data points. Effective degrees of freedom for the smoother are 3.03, and the significance is P = 0.015

