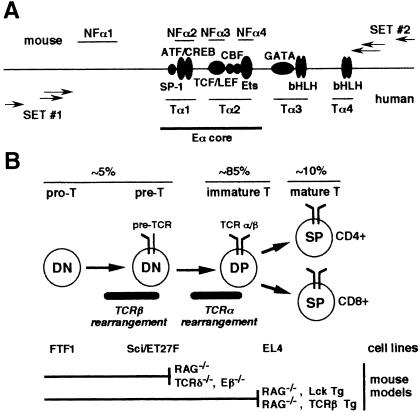
Fig. 1. (A) Comparative representation of mouse/human Eα organization. Previously identified nuclear factor binding sites are shown for the mouse (NFα1 to NFα4) and human (Tα1 to Tα4). Known transcription factor binding motifs of both the murine and human sequences are represented by gray circles and ovals. The 116 bp Eα core fragment is indicated. Arrows indicate the relative positions of primer sets 1 and 2 used in LM–PCR to analyze the bottom and top strands, respectively. (B) Schematic representation of T cell differentiation in the mouse thymus. The principal thymocyte cell stages with respect to the expression of the CD4 and CD8 markers and TCR complexes are schematized. The developmental stage of the T cell lines and T cell developmental blocks observed in the thymi of the mouse models used in this study are indicated.

An official website of the United States government
Here's how you know
Official websites use .gov
A
.gov website belongs to an official
government organization in the United States.
Secure .gov websites use HTTPS
A lock (
) or https:// means you've safely
connected to the .gov website. Share sensitive
information only on official, secure websites.
