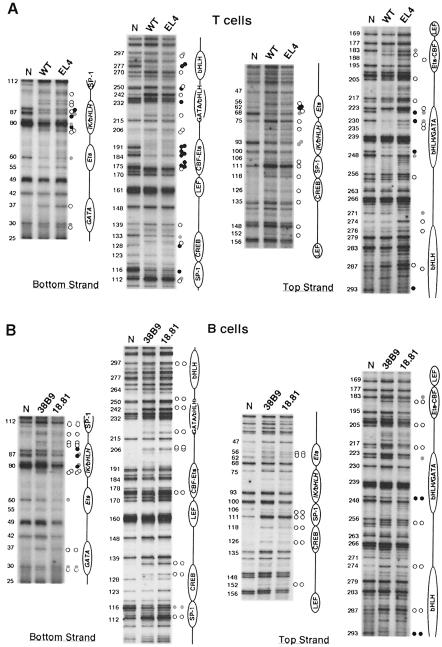
Fig. 2. Eα occupancy in wild-type thymocytes, the EL4 cell line (A) and the 38.B9 and 18.81 B cell lines (B). In vivo occupancy was determined by DMS genomic footprinting and LM–PCR. Analytical gels were run for different times to optimize band resolution for distinct regions. The numbers to the left of each panel represent the nucleotide positions based on the published murine sequence (Winoto and Baltimore, 1989), commencing at the 5′ Pvu II restriction site. The known transcription factor binding sites (in plain text) as well as the new identified potential binding sites (in italics) are indicated to the right of each panel. Filled and open circles represent protected and hypersensitive nucleotides, respectively. Gray circles represent partial protections. For (A), circles in the left column correspond to footprints found in common between wild-type thymocytes and EL4 cells; circles in the right column (top strand) are footprints specific to EL4 cells. For (B), circles in the left and right columns correspond to footprints for 38B9 and 18.81 cells, respectively. ‘N’: naked, in vitro methylated genomic DNA. In (A), C57BL/J6 wild-type thymocytes and naked DNA were used. In (B), naked DNA was from Balb/c mice.

An official website of the United States government
Here's how you know
Official websites use .gov
A
.gov website belongs to an official
government organization in the United States.
Secure .gov websites use HTTPS
A lock (
) or https:// means you've safely
connected to the .gov website. Share sensitive
information only on official, secure websites.
