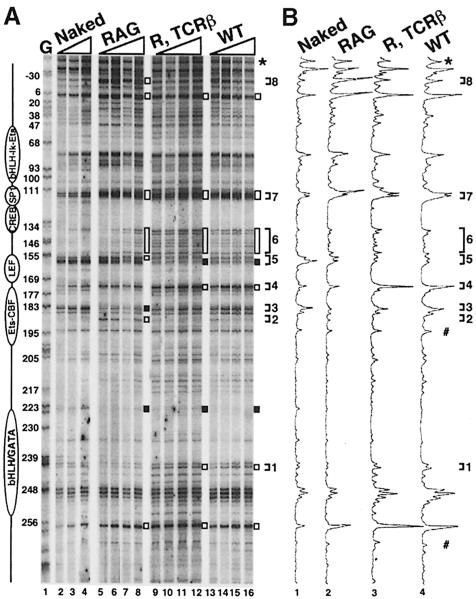
Fig. 5. In vivo DNase I genomic footprinting analysis of Eα. (A) Thymocytes from the mice indicated, as well as wild-type genomic DNA (Naked) were treated with increasing amounts of DNase I and subjected to LM–PCR (top strand analysis). Lane G is a display of guanine residues of in vitro DMS treated DNA. All mice and DNA are of C57BL/6J origin. DNase I-hypersensitive and protected regions are indicated by open and filled bars, respectively. The differences in DNase I sensitivity detected between the RAG and RAG, TCRβ or wild-type thymocytes are indicated by brackets numbered 1–8 (see details in the text). The star indicates the band used to equilibrate for peak intensity in (B). Utilization of a reference point in the intermediate or lower regions of the gel (#) gave consistent results. (B) Histogram analysis of the LM–PCR products shown in (A) [histograms 1–4 correspond to, respectively, lanes 3, 7, 11 and 15 in (A)].

An official website of the United States government
Here's how you know
Official websites use .gov
A
.gov website belongs to an official
government organization in the United States.
Secure .gov websites use HTTPS
A lock (
) or https:// means you've safely
connected to the .gov website. Share sensitive
information only on official, secure websites.
