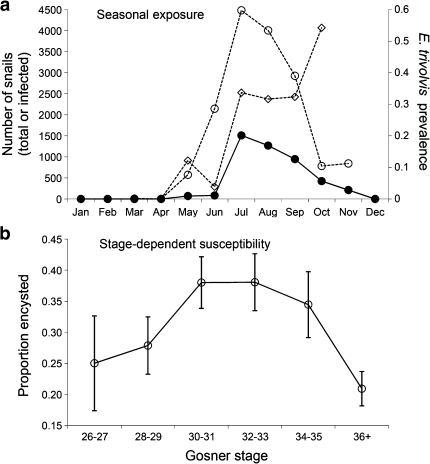
Fig. 2.
Seasonal exposure and stage-dependent susceptibility. a Seasonal changes in echinostome exposure rates of tadpoles (i.e., the estimated number of infected snails; filled circles, left axis), calculated as the product of total Planorbella trivolvis snail abundance (open diamonds, left axis) and prevalence of snails producing cercariae (open circles, right axis) (data from Sapp and Esch 1994). b Stage-dependent susceptibility to echinostome encystment as determined by the experimental infection study (mean ± SE). The number of cercariae-producing snails was assumed to be zero from December until March, during which time snails move into deep water or into the substratum (Sapp and Esch 1994), so that any cercariae produced during these months are unlikely to infect tadpoles. The exposure rate for November was estimated by averaging the estimated numbers of infected snails for October and December

