
Figure 6.
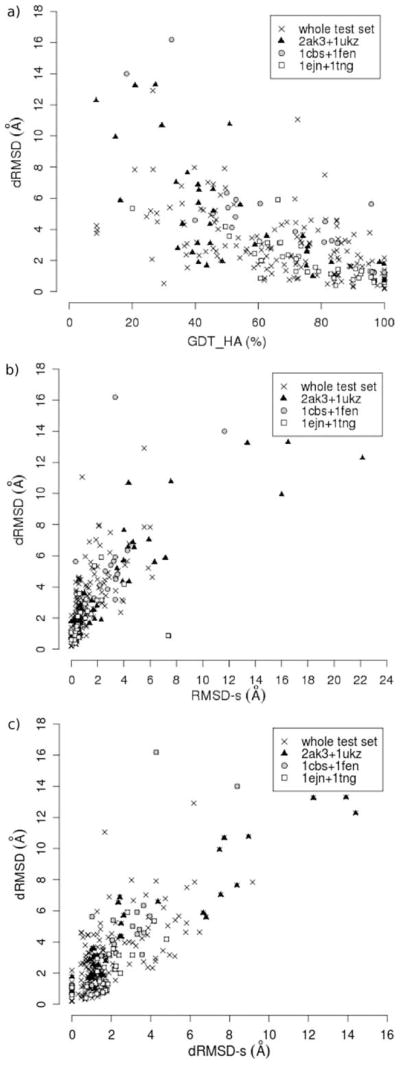
Plots of docking dRMSD vs. three calculated quality indices: GDT_HA, RMSD-s and dRMSD-s. Different symbols represent the three subsets of ligand-protein complexes reported in Table 3 (see text). The Spearman correlation coefficients for the whole test set and for each subset are reported in Table 3.