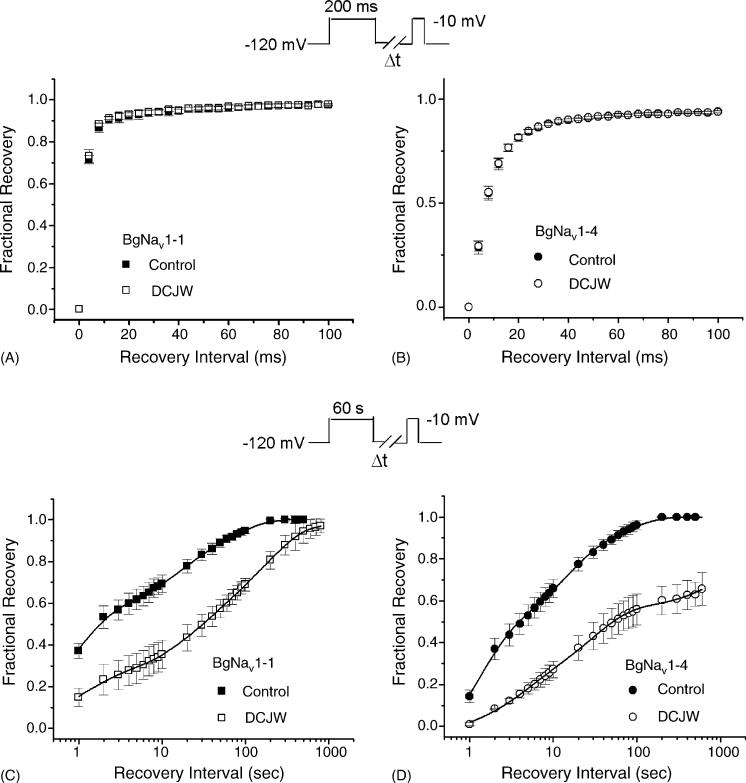
Fig. 4.
Effects of DCJW on recovery from fast inactivation and recovery from slow inactivation of BgNav1-1 (A and C) or BgNav1-4 (B and D). All data for DCJW were recorded after 30 min of DCJW (20 μM) treatment. (A and B) Recovery from fast inactivation. The protocol for recovery from fast inactivation was the same as those in Fig. 3. (C and D) Recovery from slow inactivation in the presence or absence of DCJW was measured using a 60 s depolarization to −10 mV followed by variable intervals at −120 mV and a subsequent 10 ms test pulse to −10 mV. The available current recorded with the test pulse was normalized to peak current recorded immediately prior to the recovery protocol. The lines are least-squares fits of double exponential function to the data. For BgNav1-1 in control: τ1 = 1.1 ± 0.1 s (59%), τ2 = 39 ± 2 s (41%); for BgNav1-1 exposed to DCJW: τ1 = 4.5 ± 0.2 s (34%), τ2 = 165 ± 10 s (66%); for BgNav1-4 in control: τ1 = 2.3 ± 0.2 s (56%), τ2 = 33 ± 3 s (44%); for BgNav1-4 exposed to DCJW: τ1 = 14.9 ± 1.0 s (48%), τ2 = 1572 ± 200 s (52%). Each point represents data from five oocytes.

