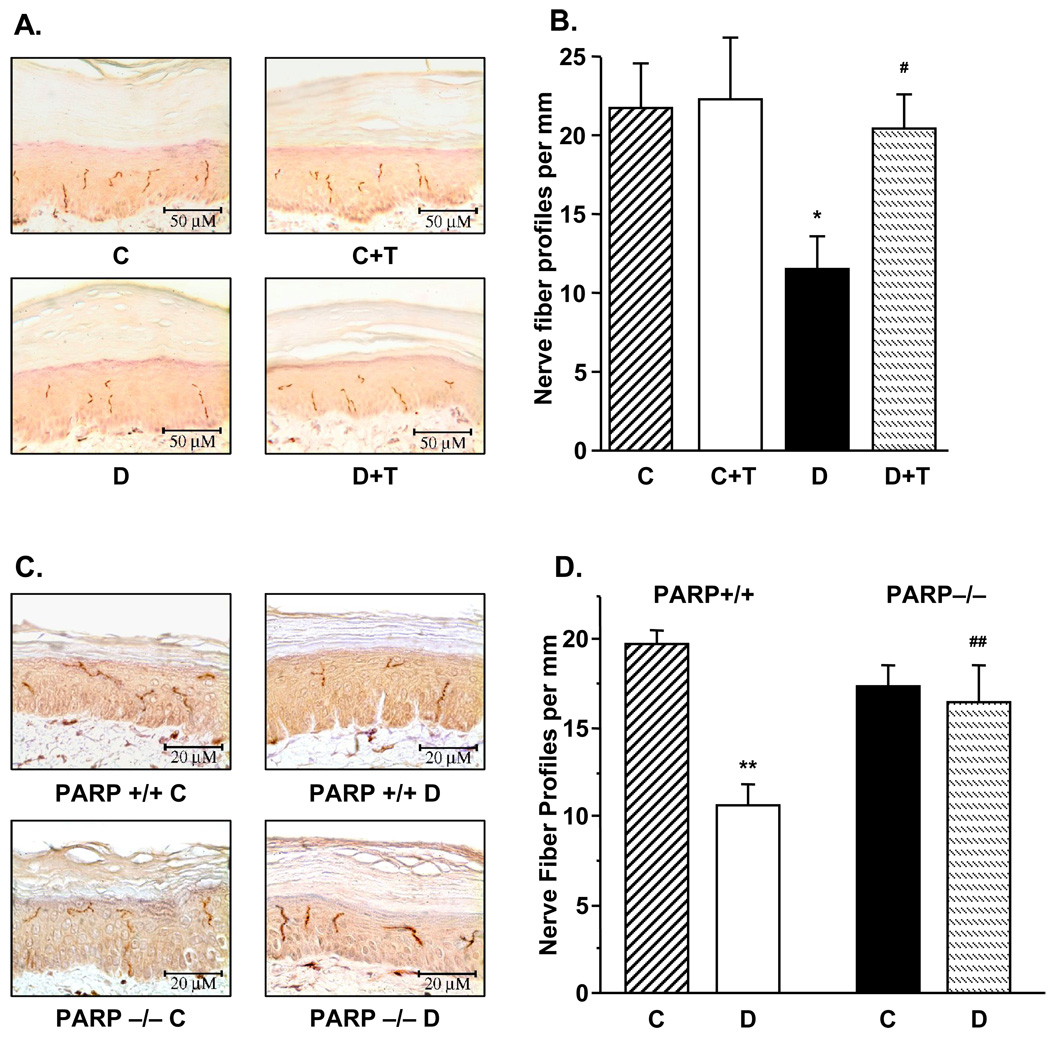
Fig.3.
A. Intraepidermal nerve fiber profiles in control and diabetic rats with and without the PARP inhibitor GPI-15427 treatment. Left – representative image of intraepidermal nerve fiber profiles, magnification × 40; Right – skin fiber density. Mean ± SEM, n = 6–9 per group. C – control rats, D – diabetic rats. T- GPI-15427 treatment. * – p < 0.05 vs control rats; # – p < 0.05 vs untreated diabetic rats. B. Intraepidermal nerve fiber profiles in control and diabetic PARP+/+ and PARP−/− mice. Left – representative image of intraepidermal nerve fiber profiles, magnification × 80; Right – skin fiber density. Mean ± SEM, n = 8–11 per group. C – control mice, D – diabetic mice. ** – p < 0.01 vs control mice; ## – p < 0.01 vs diabetic PARP+/+ mice.

